 blog
blog
As gold hits record highs, the debate intensifies: strategic hedge or speculative bet?
Picture this: It's 1971, and President Nixon just ended the gold standard, severing the dollar's convertibility to gold. The fixed price of $35 per ounce was history. Fast-forward to today—the U.S. national debt has ballooned past $35 trillion, political gridlock is the norm, and gold has just hit another record high. Coincidence? Hardly.
Gold's surge to record territory in 2025 isn't just another market anomaly. It's the result of a perfect storm: macroeconomic pressures, unprecedented central bank buying, and a world that feels increasingly unstable. But before you rush to load up on bullion, let's separate the golden truths from the fool's gold.
From Nixon's Shock to Today's Reality
When the U.S. abandoned the gold standard in 1971, few predicted what would follow. By 1980, amid soaring inflation and geopolitical chaos, gold rocketed to $850—a staggering 2,300% gain in less than a decade.
The 1980s and 1990s? Gold took a long nap, sometimes trading below $300. Then came the 21st century's wake-up calls: the dotcom crash, 9/11, the financial crisis. Gold responded like a faithful guardian, climbing to $1,900 by 2011 as central banks flooded markets with stimulus.
The pandemic era reignited gold's ascent. After touching $2,070 in 2020, the metal has surged anew since 2022. Over the past 50 years, gold has multiplied nearly 100-fold—though the journey has been anything but smooth.
Chart 1. Spot Price of Gold in U.S. dollars (2000 to Present)

Source and notes: Bloomberg Finance LP. Spot price of gold based on monthly data in U.S. dollars from Jan 2000 to May 2025 before fees, transaction costs, and taxes. You cannot invest directly in an index and past performance is no guarantee of future results.
The Rollercoaster Pattern: Crisis, Recovery, Repeat
Gold's performance varies dramatically depending on the economic backdrop of each era.
The data reveals stark contrasts: the 1970s and 2000s delivered outsized gains during periods of inflation, while the 1980s and 1990s saw gold languish. Yet, across each cycle, gold's consistent ability to recover and reach new highs reinforces its role as a potential store of value.
Chart 2. Spot price of gold average rolling 12-month change by decade
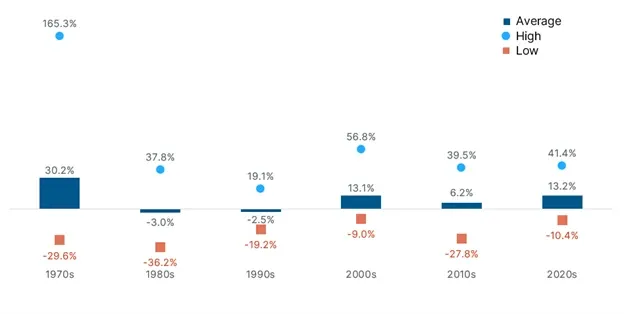
Source and notes: Bloomberg Finance LP. Spot price of gold based on monthly data in U.S. dollars from Jan 1970 to May 2025 before fees, transaction costs, and taxes. Average rolling 12-month change measured the year-over-year change in monthly gold spot prices, which means averaging each set of 12 consecutive months to smooth out short-term fluctuations and reveal longer-term trends for each decade. You cannot invest directly in an index and past performance is no guarantee of future results.
What's Really Driving Gold's Latest Rally?
Gold’s latest rally is perhaps a perfect storm of macroeconomic, structural, and psychological forces:
Dollar Doubts Are Growing
With U.S. debt ballooning past $35 trillion in 2024 and political gridlock intensifies, the dollar's shine is dimming. Gold, priced in dollars, becomes increasingly attractive as fiscal disorder looms.
Shifting Rate Expectations
Traditionally, high interest rates are gold's kryptonite. Yet, even as rates fluctuated and the Federal Reserve cut rates in late 2024, gold kept climbing—defying conventional wisdom about the metal's sensitivity to monetary policy.
Central Banks Are Loading Up
According to World Gold Council data, central banks acquired 3,217 tonnes of gold from 2022-2024, compared to just 1,310 tonnes during 2019-2021. That's more than double. Their aim? Diversify reserves, reduce dollar exposure, and inoculate against sanctions risk.
Everyone's Buying In
It's not just central banks. From ETFs to warehouse clubs selling gold bars alongside bulk toilet paper, retail demand has surged. Institutions are equally hungry for assets that can weather macroeconomic and fiscal policy uncertainty.
The "Trump Effect" Amplifies Uncertainty
Tariffs, "America First" policies, and unpredictable geopolitical moves have fueled inflation fears and global uncertainty. Each surprise policy announcement seems to push gold higher, reinforcing its role as a hedge against political and economic instability.
The Diversification Reality Check
One of gold's most compelling attributes is its often-touted low to negative correlation with stocks and bonds. Chart 3 presents a rolling 36-month correlation between gold, U.S. equities, and U.S. bonds, illustrating how these relationships have shifted over time. While gold has historically provided a crucial counterbalance during periods of equity market stress or rising inflation, it’s important to recognize that these diversification benefits have not been consistent.
Gold's reputation as a portfolio diversifier is both earned and overrated. In fact, since 1980, gold has exhibited low or negative correlation to U.S. equities and bonds only about 25% of the time. Extreme negative correlations? Less than 10% of observations.
These stabilizing effects tend to materialize during brief, high-stress periods—market crashes, inflationary spikes, and geopolitical shocks—functioning more like episodic "insurance" than a persistent diversifier. This dynamic means that relying on gold as a tactical timing tool is fraught with risk. The sudden shifts in correlation are often driven by unpredictable macroeconomic or geopolitical events that defy forecasting.
For most investors, gold's true value lies not in predictable diversification, but as a hedge against tail risks—providing resilience when it's needed most.
Chart 3. Rolling 36-month correlation of spot gold price to U.S. Equities and U.S. bonds
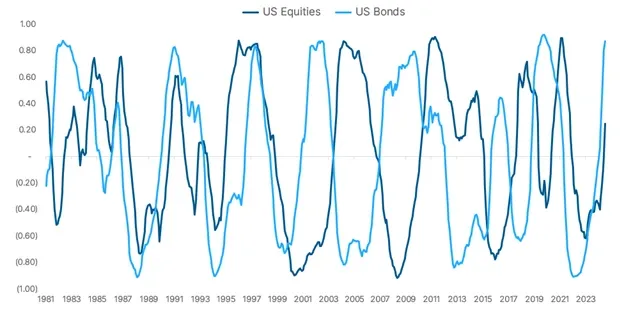
Source and notes: Bloomberg Finance LP. Spot price of gold based on monthly data in U.S. dollars from May 1981 to May 202[ND1] 5 before fees, transaction costs, and taxes. U.S. equities proxied by the S&P500 Index in U.S. dollars, and U.S. bonds proxied by the Bloomberg U.S. Aggregate Bond Index, or the Agg, is a broad base, market capitalization-weighted bond market index representing intermediate term investment grade bonds traded in the United States. You cannot invest directly in an index and past performance is no guarantee of future results.
Gold Across Economic Climates: The Performance Reality
Gold's performance is closely linked to two key forces: inflation and interest rates. Gold thrives during stagflation—those rare stretches of high inflation and sluggish growth that plagued the 1970s and resurfaced in the early 2020s. When economies stagnate while prices soar, gold's role as a store of value comes to the forefront.
But gold doesn't need full-blown stagflation to shine. Any broader inflationary environment works in its favour. As rising prices erode the real value of cash and bonds, investors typically turn toward tangible assets that are less likely to be impacted by inflation, helping preserve wealth.
The flip side? When central banks raise interest rates to combat inflation, gold tends to struggle. Suddenly, bonds and savings accounts offer attractive yields while gold sits there earning nothing. But history shows these periods are temporary. Once markets realize inflation is stickier than expected, or new uncertainties emerge, gold typically regains its footing.
Chart 4 compares gold's performance to U.S. and Canadian equities and U.S. bonds across different inflationary regimes, revealing a nuanced picture. Gold has outperformed during inflationary shocks, but can lag when risk assets are in favour, particularly during "Goldilocks" periods of steady growth and moderate inflation. In such environments, equities and bonds may deliver stronger returns, while gold quietly serves as portfolio insurance, waiting for its next opportunity to potentially shine.
Chart 4. Behaviour of asset classes in different inflationary regimes
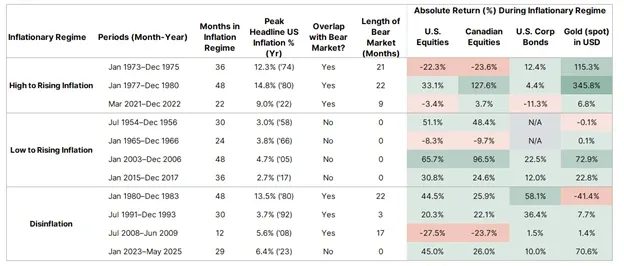
Source and notes: Bloomberg Finance LP. Spot price of gold based on monthly data in U.S. dollars from Jan 1973 to May 2025 before fees, transaction costs, and taxes[ND1] . U.S. equities proxied by the S&P500 Index in U.S. dollars. U.S. bonds proxied by ICE BofA U.S. Corporate Index Total Return Index Value, Index, Monthly, Not Seasonally Adjusted. Canadian equities proxied by S&P/TSX Composite Index in Canadian dollars, before transaction costs, fees and taxes. You cannot invest directly in an index and past performance is no guarantee of future results.
Our understanding of these relationships is limited by the relatively small number of true inflationary or stagflationary episodes in modern history—each with its own unique context. Historical data provides valuable insights, but the relationship between gold, macroeconomic trends and other asset classes evolves over time.
Gold's performance, like any asset, depends on the economic backdrop. Its diversification benefits are real but episodic, and its interactions with equities and bonds are subject to change. The real strength of gold is its ability to provide resilience during periods of stress—offering protection when other assets falter, but not guaranteeing consistent outperformance or diversification.
The Psychology Behind the Purchase
Let's face it. Gold isn't just about finance—it's about feelings.
Since ancient times, gold has symbolized wealth, power, and permanence in an impermanent world. When headlines scream crisis, the rush into gold becomes self-fulfilling, pushing prices higher. It's loss aversion in action: the pain of losing money outweighs the joy of gains, driving investors toward something tangible when the digital world feels ephemeral.
Strategic Anchor or Speculative Gamble?
The key distinction lies in how you approach gold allocation.
The Strategic Case
Gold offers several potential benefits for long-term wealth preservation:
- Correlation benefits during stress periods: Its historically low correlation with stocks and bonds can help smooth portfolio volatility
- Modern accessibility: ETFs and digital platforms make exposure easier than ever
- Crisis resilience: Consistently preserves purchasing power during inflation and currency crises
The Speculative Risk
Treating gold as a primary investment vehicle introduces risks:
- No yield: Unlike stocks or bonds, gold generates zero income
Opportunity cost: Money in gold isn't compounding in growth assets like stocks - Sentiment sensitivity: Prices can swing, as seen in May 2025, when trade deal rumours led to a swift 5% drop.
The takeaway? Gold's greatest value lies in its role as a stabilizer within a diversified portfolio—helping to manage risk and preserve capital during periods of market stress, rather than serving as a primary engine of growth or a speculative vehicle.
Gold’s Enduring, Yet Nuanced, Role
Gold's journey from $35 to $3,400 per ounce is a tale of crises, comebacks, and the enduring human desire for security. It can serve as a potential portfolio diversifier, store of value, and—crucially—insurance against scenarios where traditional diversification fails.
But gold isn't a panacea. Its lack of yield, sensitivity to unpredictable forces, and episodic benefits mean it works best as a strategic stabilizer rather than a portfolio centrepiece. The key is approaching gold with realistic expectations about its role and limitations.
Whether driven by macroeconomic concerns, historical precedent, or prudent risk management, successful gold allocation requires the same principles that guide all sound investing: discipline, diversification, and intellectual honesty about what works—and when.